
United Nations Member States gathered together at the start of the new millennium to shape a broad vision to fight poverty and combat numerous issues hampering development progress. The vision was translated into eight Millennium Development Goals and has remained the world’s overarching development framework for the past 15 years. This framework, set to expire in 2015, includes time-bound goals, targets and indicators to monitor progress on extreme poverty and hunger, education, gender equality, child survival, health, environmental sustainability and global partnerships.
This chart presents the final assessment of progress towards selected key tar- gets relating to each goal. The assessment provides two types of information: progress trends and levels of development, which are based on information available as of June 2015. The colour shows progress made towards the target and the text in the box shows the present level of development. For most indicators, 2015 projections are used to assess progress; for a few indicators that do not have 2015 data or projections, the latest available data of 2013 or 2014 are used.
Millennium Development Goals: 2015 Progress Chart
| Goals and Targets | Africa | Asia | Oceania | Latin America and the Caribbean | Caucasus and Central Asia | ||||
| Northern
|
Sub-Saharan | Eastern | South-Eastern | Southern | Western | ||||
| GOAL 1 | Eradicate extreme poverty and hunger | |||||||||
| Reduce extreme poverty by half | low poverty | very high poverty | low poverty | moderate poverty | high poverty | low poverty | — | low poverty | low poverty |
| Productive and decent employment | large deficit | very large deficit | moderate deficit | large deficit | large deficit | large deficit | very large deficit | moderate deficit | small deficit |
| Reduce hunger by half | low hunger | high hunger | moderate hunger | moderate hunger | high hunger | moderate hunger | moderate hunger | moderate hunger | moderate hunger |
| GOAL 2 | Achieve universal primary education | |||||||||
| Universal primary schooling | high enrolment | moderate enrolment | high enrolment | high enrolment | high enrolment | high enrolment | high enrolment | high enrolment | high enrolment |
| GOAL 3 | Promote gender equality and empower women | |||||||||
| Equal girls’ enrolment in primary school | close to parity | close to parity | parity | parity | parity | close to parity | close to parity | parity | parity |
| Women’s share of paid employment | low share | medium share | high share | medium share | low share | low share | medium share | high share | high share |
| Women’s equal representation in national parliaments | moderate representation | moderate representation | moderate representation | low representation | low representation | low representation | very low representation | moderate representation | low representation |
| GOAL 4 | Reduce child mortality | |||||||||
| Reduce mortality of under- five-year-olds by two thirds | low mortality | high mortality | low mortality | low mortality | moderate mortality | low mortality | moderate mortality | low mortality | low mortality |
| GOAL 5 | Improve maternal health | |||||||||
| Reduce maternal mortality by three quarters | low mortality | high mortality | low mortality | moderate mortality | moderate mortality | low mortality | moderate mortality | low mortality | low mortality |
| Access to reproductive health | moderate access | low access | high access | moderate access | moderate access | moderate access | low access | high access | moderate access |
| GOAL 6 | Combat HIV/AIDS, malaria and other diseases | |||||||||
| Halt and begin to reverse the spread of HIV/AIDS | low incidence | high incidence | low incidence | low incidence | low incidence | low incidence | low incidence | low incidence | low incidence |
| Halt and reverse the spread of tuberculosis | low mortality | high mortality | low mortality | moderate mortality | moderate mortality | low mortality | moderate mortality | low mortality | moderate mortality |
| GOAL 7 | Ensure environmental sustainability | |||||||||
| Halve proportion of population without improved drinking water | high coverage | low coverage | high coverage | high coverage | high coverage | high coverage | low coverage | high coverage | moderate coverage |
| Halve proportion of population without sanitation | moderate coverage | very low coverage | moderate coverage | low coverage | very low coverage | high coverage | very low coverage | moderate coverage | high coverage |
| Improve the lives of slum-dwellers | low proportion of slum-dwellers | very high proportion of slum-dwellers | moderate proportion of slum-dwellers | moderate proportion of slum-dwellers | moderate proportion of slum-dwellers | moderate proportion of slum-dwellers | moderate proportion of slum-dwellers | moderate proportion of slum-dwellers | — |
| GOAL 8 | Develop a global partnership for development | |||||||||
| Internet users | moderate usage | low usage | high usage | moderate usage | low usage | high usage | low usage | high usage | high usage |
For the regional groupings and country data, see mdgs.un.org. Country experiences in each region may differ significantly from the regional average. Due to new data and revised methodologies, this Progress Chart is not comparable with previous versions.
Sources: United Nations, based on data and estimates provided by: Food and Agriculture Organization of the United Nations; Inter-Parliamentary Union; International Labour Organization; International Telecommunication Union; UNAIDS; UNESCO; UN-Habitat; UNICEF; UN Population Division; World Bank; World Health Organization – based on statistics available as of June 2015.
Compiled by the Statistics Division, Department of Economic and Social Affairs, United Nations.
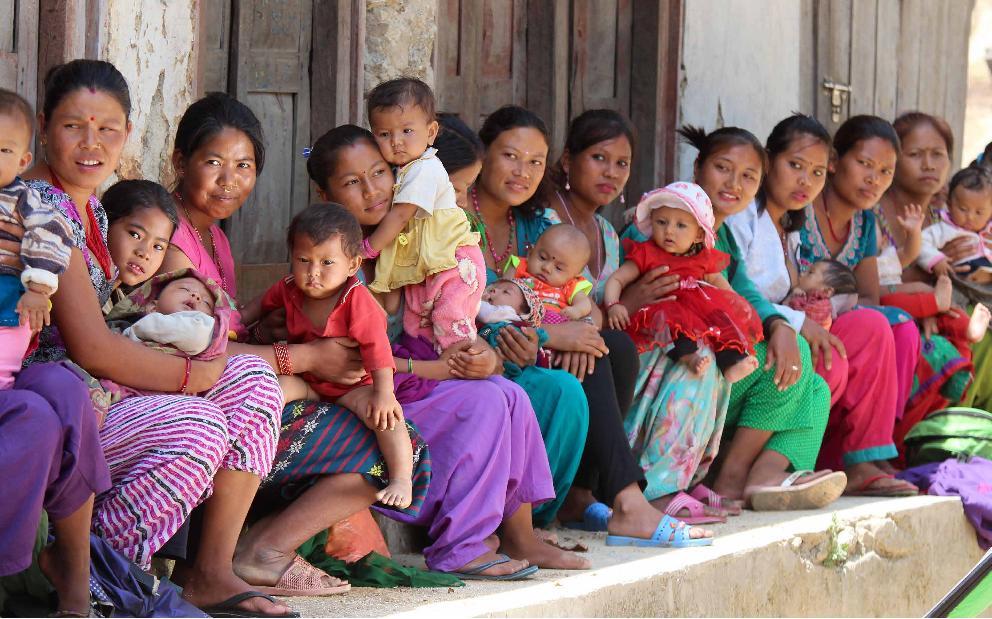
Photo credit: © UNICEF/Newar

Leave a Reply